How to do sieve analysis testing?
Friday August-01 2025 16:51:35
The Sieve analysis test is a method used to detect the particle size distribution of materials. It can quickly detect sample particle sizes from 125 mm to 20 microns. The sieve frame diameters are 75 mm, 100 mm, 200 mm, 300 mm and 400 mm. The following are sample analysis and testing methods for common materials:
| Test Material | Screening Method | Screening Mesh Size (Mesh/Inch) | Mesh Size (mm) | Screen Frame Diameter (mm) | Application Industry | Remarks |
| Soil | Dry/Wet Screening | 10-325 Mesh | 2.0-0.045 | 200, 300 | Geology, Agriculture, Environmental Protection | Requires tiered screening, commonly using a 300mm sieve frame to detect particle gradation |
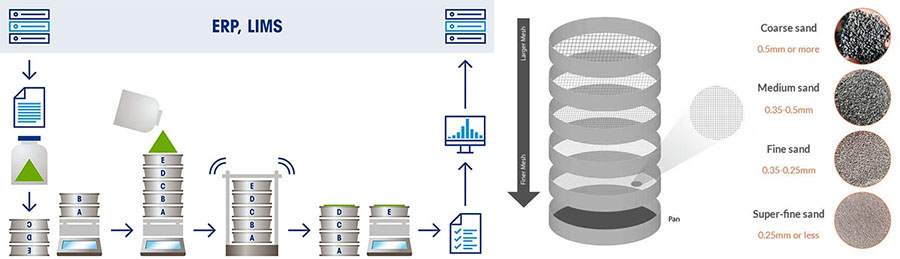
| Sand and Gravel (Quartz Sand) | Dry Screening | 4-100 Mesh | 4.75-0.15 | 200, 300 | Building Materials, Casting | Graded according to GB/T 14684. A 300mm sieve frame is suitable for coarse particle screening |
| Aggregate (Stone) | Dry Screening | 5-40 mesh | 0.15-9.5 | 300, 400 | Concrete, Highway Engineering | A square hole screen is required. A 400mm screen frame is used for large-volume screening. |
| Cement Powder | Negative Pressure Screening | 45-325 mesh | 0.08-0.3 | 75, 200 | Building Materials, Quality Inspection | A stable negative pressure of 4000-6000 Pa is required for optimal screening efficiency. |
| Diamond Micropowder | Slap Screening | 200-400 Mesh | 0.038-0.075 | 75, 200 | Superhard Materials, Abrasives | High-precision Screening, Anti-Blocking Mesh Design |
| Glass Bead Powder | High-Frequency Vibration Screening | 20-200 Mesh | 0.075-0.85 | 75, 100, 200 | Optics, Chemicals | Vibration Frequency Control Required (500 times/min) |
| Activated Carbon | Dry Screening | 40-100 Mesh | 0.15-0.42 | 200, 300 | Environmental Protection, Water Treatment | Anti-static requirements, recommended screen material: stainless steel 4 |
| Traditional Chinese Medicine Powder | Pharmacopoeia Screening | 50-200 Mesh | 0.075-0.3 | 200 | Pharmaceutical Industry | Complies with Pharmacopoeia standards, requires moisture-proof treatment |
Why is sieve analysis test important?
1. Determine the gradation of aggregates: ensure that the particle size distribution of aggregates meets the design requirements.
2. Control the density of concrete: reasonable aggregate grading can improve the density of concrete and reduce porosity.
3. Improve the strength of concrete: high-density concrete has higher strength and durability.
4. Reduce costs: by optimizing the aggregate ratio, material waste can be reduced and costs can be reduced.
In addition, sieving analysis can also help us identify and remove aggregates with irregular shapes and high mud content, thereby improving the quality of concrete.
How do you perform a sieve analysis test?
The Sieve Analysis test consists of five steps: preliminary material preparation, sample pretreatment, sieving, data recording, and result analysis. The specific steps are as follows:
1. Preliminary Preparation: Select a standard sieving method based on the material characteristics, determine the sieve size and sample size (which can be adjusted through preliminary experiments). Mark and weigh each empty sieve (tare weight) in advance, and arrange the sieve racks from largest to smallest or smallest to largest apertures.
2. Sample Preparation: Take a representative sample and perform pretreatment such as drying or crushing to ensure dispersion.
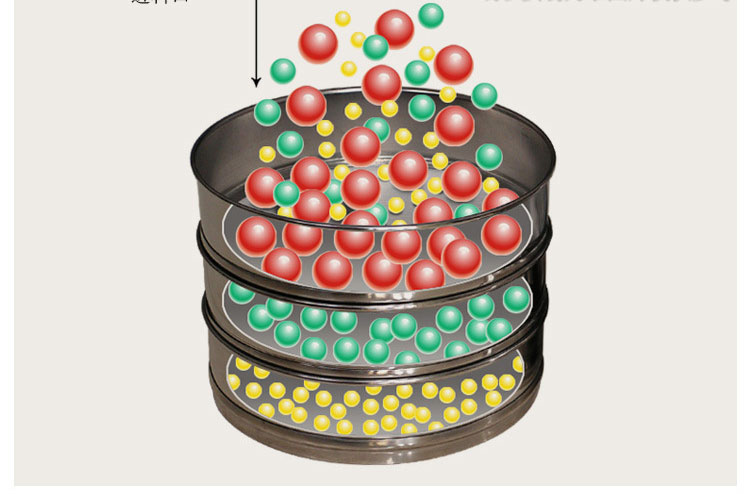
3. Sieving: Pour the sample onto the top sieve and sieve manually or mechanically to achieve thorough particle separation.
4. Data Recording: After sieving, weigh the residual material on each sieve in sequence, deduct the tare weight, and obtain the net weight.
5. Result Analysis: Calculate the proportion of each particle size range, generate a distribution curve or table, and evaluate the material's particle size characteristics.
What are the steps in the sieve analysis test?
Weigh a representative sample, and take about 500g of sample to set as the total sample (or according to the industry standard).
| SI | Maximum size of material present in substantial quantities | Weight to be taken for test in Kgs |
| 1 | 75mm | 60Kg |
| 2 | 40mm | 25Kg |
| 3 | 25mm | 13Kg |
| 4 | 19mm | 6.5Kg |
| 5 | 12.5mm | 3.5Kg |
| 6 | 10mm | 1.5Kg |
| 7 | 6.5mm | 0.75Kg |
| 8 | 4.75mm | 0.4Kg |
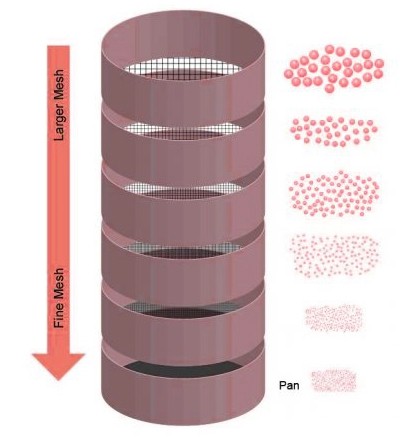
Stack the sieves according to the aperture size of the Analytical Test Sieves. The sieve with a large opening (small aperture value) is placed above the small opening (large aperture value), and the bottom end prevents the tray from collecting samples passing through all apertures. #4 and #200 sieves should always be included in the analysis of samples.
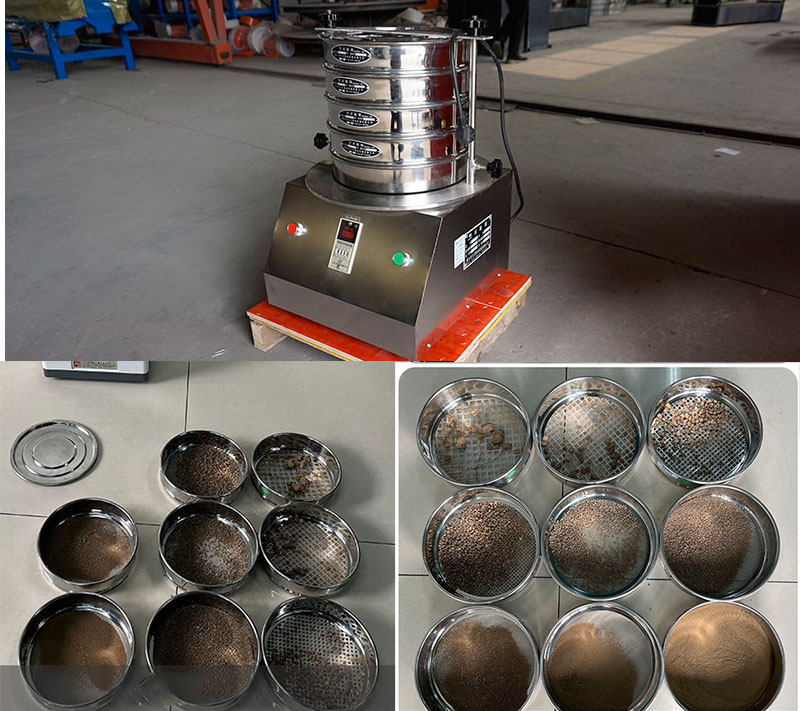
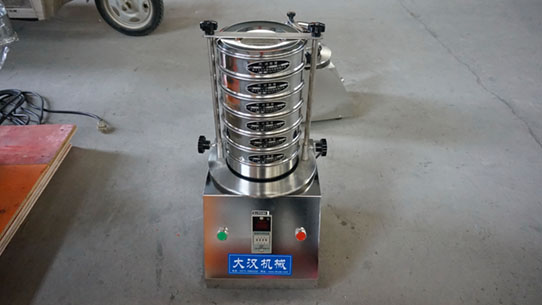
Put the weighed 500g sample into the top sieve of Analytical Test Sieves, place it on the laboratory vibrating sieve (the sample together with all the Analytical Test Sieves stacked together), fix the sieve frame, set the analysis time, and start the machine.
After the machine stops running, the sieve frames are taken out one by one and the weight of the sample retained in each sieve frame is weighed.
Sample retention, data recording, and analysis are performed to derive particle size distribution curves.
If you need to perform comparative analysis of different samples, please keep weighing, use the same model of Analytical Test Sieves, and use the same analysis time (control variable) to conduct sample analysis and comparison.

How to do sieve analysis calculations?

The particle size distribution of a soil sample can be obtained by plotting the finer percentage with the corresponding sieve on semi-logarithmic graph paper as shown below.
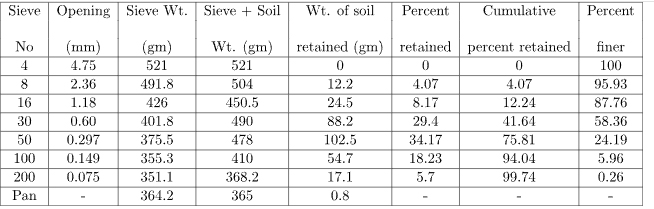
Once the sieving process is complete, the results need to be calculated and interpreted. The mass of particles retained on each sieve is determined by dividing the mass retained on each sieve by the total mass of the soil sample retained and then multiplying by 100 to find the percentage retained on each sieve. To better understand the distribution of particle sizes, it is useful to calculate the cumulative percentage retained for the soil sample.
Sieve analysis test sample report
Typically, this is done by weighing the material remaining on each sieve in the pile. This should equal the weight of a representative sample. It is also possible to look at the percentage of material that has passed through. For example, determine the amount of material that has passed through the top sieve, record it, and then do the same for the material that has passed through the second sieve. Continue this process until you reach the lower part of the pile of sieves.
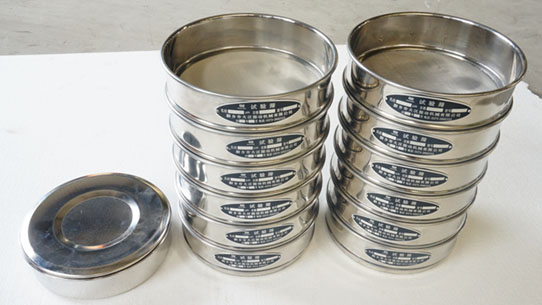
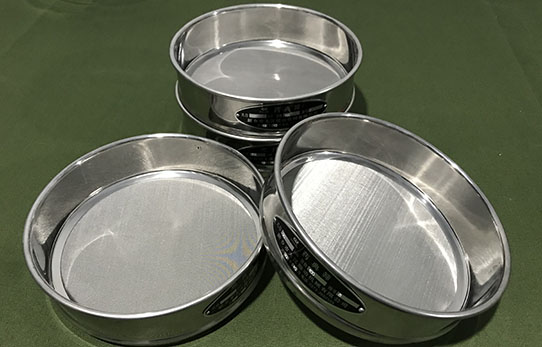
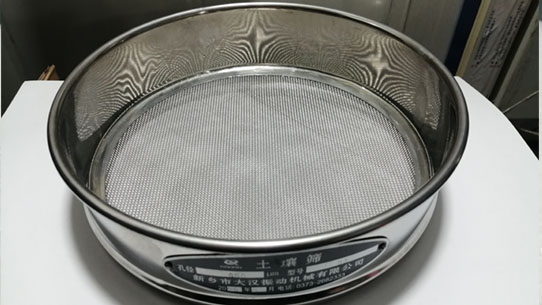 laboratory test sieve